
Stepwise Regression with Minitab
What is Stepwise Regression?
Stepwise regression is a statistical method to automatically select regression models with the best sets of predictive variables from a large set of potential variables. There are different statistical methods used in stepwise regression to evaluate the potential variables in the model:
[unordered_list style=”star”]
- F-test
- T-test
- R-square
- AIC
[/unordered_list]
Three Approaches to Stepwise Regression
[unordered_list style=”star”]
- Forward Selection
Bring in potential predictors one by one and keep them if they have significant impact on improving the model. - Backward Selection
Try out potential predictors one by one and eliminate them if they are insignificant to improve the fit. - Mixed Selection
Is a combination of both forward selection and backward selection. Add and remove variables based on pre-defined significance threshold levels.
[/unordered_list]
How to Use Minitab to Run a Stepwise Regression
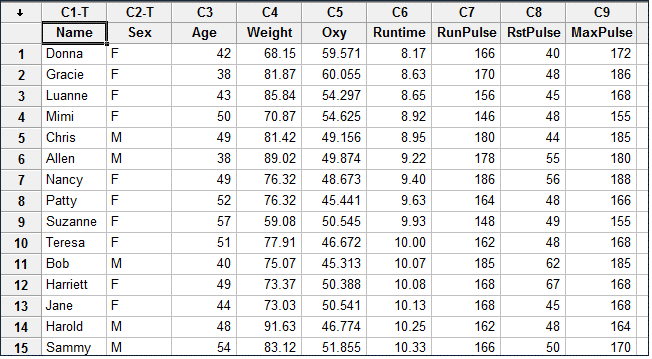
Case study: We want to build a regression model to predict the oxygen uptake of a person who runs 1.5 miles. The potential predictors are:
[unordered_list style=”star”]
- Age
- Weight
- Runtime
- Runpulse
- RstPulse
- MaxPulse
[/unordered_list]
Data File: “Stepwise Regression” tab in “Sample Data.xlsx”
Sample Data Glance
Steps to run stepwise regression in Minitab:
- Click Stat → Regression → Regression → Fit Regression Model
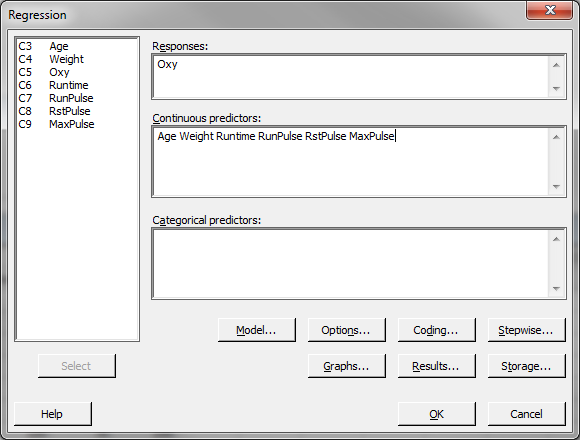
- A new window named “Regression” appears.
- Select “Oxy” as the “Responses” and select all the other variables into the “Continuous Predictors” box.
- Click the “Stepwise” button and a new window named “Regression: Stepwise” pops up.
- Select the method of stepwise regression and enter the alphas to enter/remove. In this example, we use the “Forward selection” method and the alpha to enter is 0.25.
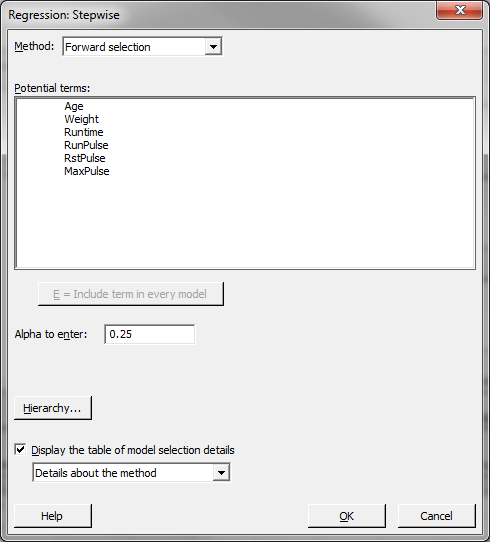
- Click “OK” in the window “Stepwise – Methods.”
- Click “OK” in the window “Stepwise Regression.”
- The results appear in the session window.
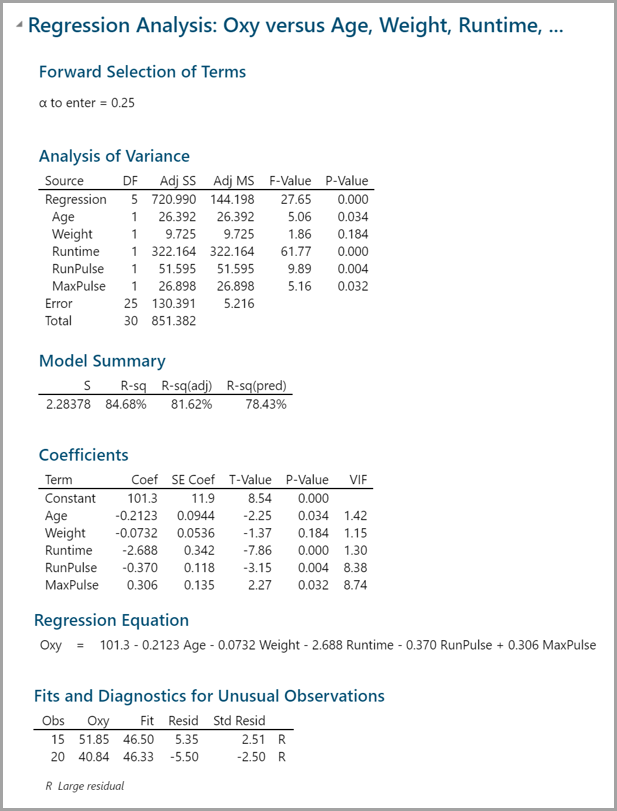
Model summary: One out of six potential factors is not statistically significant since its p-value is higher than the alpha to enter. Step History: Step-by-step records on how to come up with the final model. Each column indicates the model built in each step.